ChatBot vs Form
User research compares form and chatbot's user experience in the clinical context.
Background
I dove deep into a specific pain point found in my passion project
During the research phase of my passion project, SomeoneLikesYou,
I found a pain point in the user onboarding; users get annoyed when filling out a long form.
I believe ChatBot could be a solution to relieve users from this fretful process. Therefore, I gathered 5 members and designed an in-lab experiment.
Role
Lead UX Researcher
Duration
6 weeks
Findings and Impact
Chatbot got better results in user performance and user satisfaction. Yet the form prototype shows less task completion time. A detailed analysis can be found in this report.
Following are key results of the research:


I created a Chatbot representative for my passion project.
Click to see the case study:
01.
DEFINE
Market Analysis
Current market position of both approaches
I conducted a competitive analysis and found that most of the Chatbots in the market are designed to support customer representatives.
There are few chatbots designed for information collection, not to mention for product onboarding. Among those products, we found Amazon Bot and Bank of America Erica providing similar use cases.
SWOT Analysis


Developed Personas
Two types, two potential preferences
By modifying the personas I created for SomeoneLikesYou, I created personas for this testing. Different user types may favor different data collecting methods.

Participants
We recruited 16 participants with a diverse demographic background
We scheduled 16 participants in total, 10 of them are living with at least one health concern and 6 of them consider being healthy.
We labeled them and categories them into separate user groups.
Tester number: 16
Gender: 9 female/ 7 male
Age: 20-55
Results presentation
"This is the most enjoyable presentation I ever listened"
02.
DESIGN
Sketch & Brainstorm

Procedure
Welcome to our lab experiment
We assigned 16 participants respectively in each prototype and asked them to complete the task.
I designed the questions referring to the registration process of clinical websites (Umass Medical School) and the patient's community (PatientsLikeMe).
Here is the procedure for our lab experiment:

Prototypes
Interact with only one prototype
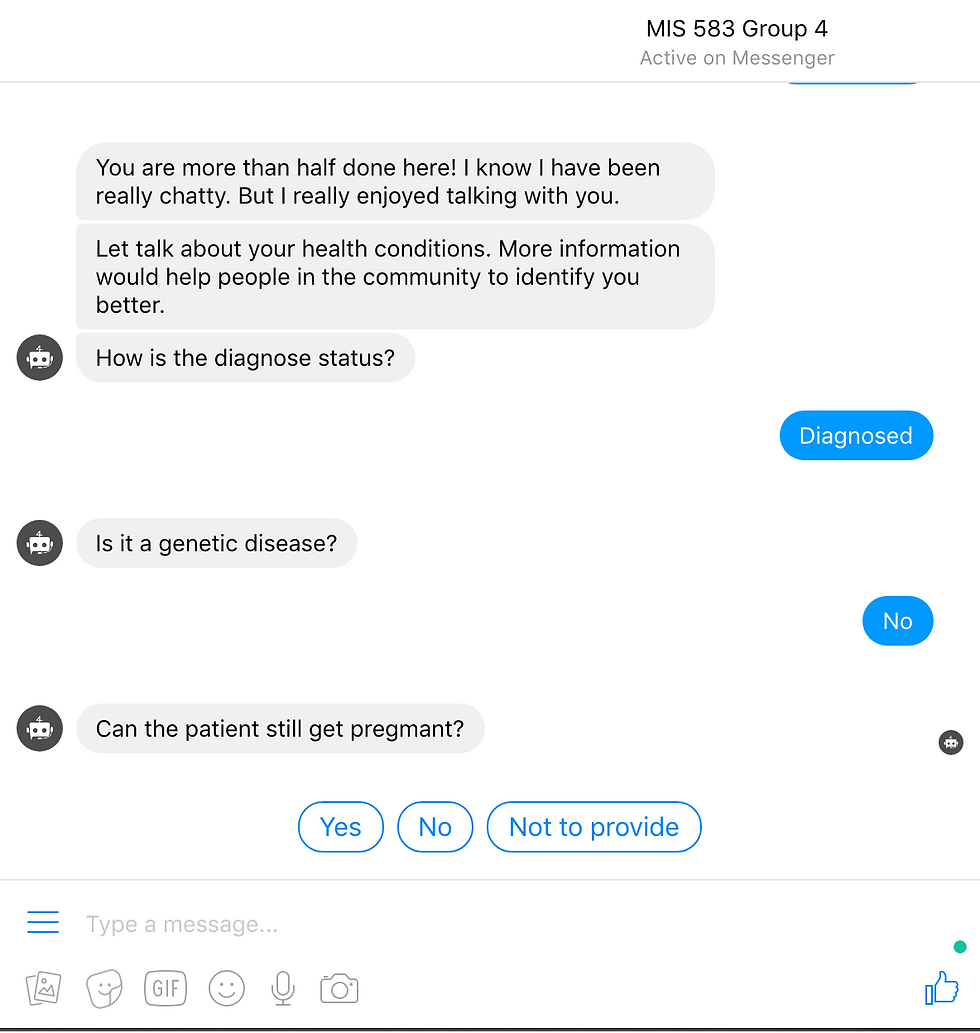
Using the same question set, we created two prototypes. Hovering over the following sections to see the screenshots of the actual experiment.
To ensure the accuracy of the results, each participant can only interact with one prototype in the experiment.
Note that one interesting thing we designed in the chatbot prototype is shortcuts. For instance, if you already set the gender as a Male, the Bot would skip the questions for pregnancy.


ChatBot


Form


* The question set was designed to be intentionally long.
Measurements
We planned to measure our experiment on two dimensions: Subjective and Objective.
We collected the data using the pre-test questionnaire, post-text questionnaire. We also measured the participant's no-verbal data during the testing, such as reactions, expressions.

03.
CONDUCT
Pilot Experiment
Trial first, real experiment follows
We asked a UX professional to do a trial experiment and got lots of valuable inputs from this pilot experiment.
• Clarifying the testing goal at the beginning of the test. The tester mentioned that participants might be offended as we asked for a great amount of personal information with no context.
• Communicate the limitation of the prototype. The tester got confused between choosing and inputting answers and did both for one question. We figured a disclaimer at the beginning of the testing could help to reduce the confusion.
User Experiment


User Quotes

04.
RESULTS

Data Analysis
Here is a statistical analysis of our testing data.
We looked into the subjective measurement such as the score rated by testers and the objective measurement such as question-answer rates.

👈 Chatbot participants performed better and love it.
We calculated the SUS score of two prototypes so we could quantify the data and make side-by-side comparisons.
The average SUS scores for form and chatbot are 59.375 and 66.875. Meanwhile, the satisfaction rates of form and chatbot are 6.625 and 7.375.
Both tested groups favored Chatbot 👉
Half of the testers chose to use the Chatbot when offered a chance to use the form.
This result shows that Chatbot can be an approach to increase user stickiness.


👈 Higher question-answer rate in Chatbot
A design can exert a huge impact on the questions’ answer rate.
Chatbot shows how to design more implicitly can elicit the desired result by shaping the conditions for more natural responses.
Surprising Facts
We will not look for the results we already assumed
-
Data speaks
The Chatbot received only a slightly higher satisfaction rate and SUS score than form while almost all positive feedbacks are given to Dunbot.
-
Task matters
Participants reported a longer perceived time than actual completion time on both prototypes. We assumed that the reason for this result is inherent in the length of question sets.
-
A new solution may come with new problems
Chatbots have their own limitations. It's also harder to maintain when it comes to scalability.
Reflections
Articulate the design rationale logically to participants can earn trust.
Designing for altering people’s behavior is always tricky. Though I designed the pre-test instructions, the preparations are always insufficient when dealing with real users.
What users said is not what they want. It’s hard to get genuine feedback from the lab environment.


